


Authentic CompTIA DY0-001 Exam Dumps PDF - 2026 Updated
Get Prepared for Your DY0-001 Exam With Actual 85 Questions
NEW QUESTION # 18
A data scientist is working with a data set that covers a two-year period for a large number of machines. The data set contains:
* Machine system ID numbers
* Sensor measurement values
* Daily timestamps for each machine
The data scientist needs to plot the total measurements from all the machines over the entire time period.
Which of the following is the best way to present this data?
- A. Histogram
- B. Box-and-whisker plot
- C. Line plot
- D. Scatter plot
Answer: C
Explanation:
# Line plots are ideal for visualizing data trends over continuous time. In this case, plotting the total daily measurements across a two-year period is a time series task, and a line plot shows progression and pattern over time clearly.
Why the other options are incorrect:
* A: Scatter plots are better for relationship exploration, not time trends.
* C: Histograms display distribution - not suitable for continuous time trends.
* D: Box plots show spread and outliers - not temporal behavior.
Official References:
* CompTIA DataX (DY0-001) Study Guide - Section 1.2:"Use line plots for visualizing temporal trends in time-series data."
* Time Series Visualization Guide, Chapter 2:"Line plots are effective for showing cumulative or aggregated values over time."
-
NEW QUESTION # 19
A data scientist is building a forecasting model for the price of copper. The only input in this model is the daily price of copper for the last ten years. Which of the following forecasting techniques is the most appropriate for the data scientist to use?
- A. Dynamic time warping
- B. Relative strength
- C. Moving average
- D. Autoregressive
Answer: D
Explanation:
An autoregressive model uses past values of the series itself (here, historical daily copper prices) as predictors for future values, making it the most suitable technique when only the time‐series history is available.
NEW QUESTION # 20
Which of the following is a key difference between KNN and k-means machine-learning techniques?
- A. KNN is used for classification, while k-means is used for clustering.
- B. KNN is used for finding centroids, while k-means is used for finding nearest neighbors.
- C. KNN performs better with longitudinal data sets, while k-means performs better with survey data sets.
- D. KNN operates exclusively on continuous data, while k-means can work with both continuous and categorical data.
Answer: A
Explanation:
KNN is a supervised algorithm that assigns labels based on the closest labeled examples, whereas k-means is an unsupervised method that partitions data into clusters by finding centroids without using any pre-existing labels.
NEW QUESTION # 21
A data scientist is using the following confusion matrix to assess model performance:
The model is predicting whether a delivery truck will be able to make 200 scheduled delivery stops. Every time the model is correct, the company saves an hour in planning and scheduling of maintenance work. Every time the model is wrong, the company loses four hours of delivery time for the truck. Which of the following is the net model impact for the company?
- A. 165 hours lost
- B. 25 hours lost
- C. 165 hours saved
- D. 25 hours saved
Answer: B
Explanation:
Treat each "predicted-to-fail" and "predicted-to-succeed" row as coming from 100 cases apiece (200 total).
NEW QUESTION # 22
A data scientist is creating a responsive model that will update a product's daily pricing based on the previous day's sales volume. Which of the following resource constraints is the data scientist's greatest concern?
- A. Deployment time
- B. Development time
- C. Data collection time
- D. Training time
Answer: D
Explanation:
# Since the model must update daily based on new data, retraining must be fast enough to meet daily deadlines. Therefore, training time is the critical constraint - it determines whether pricing updates can be executed promptly.
Why the other options are incorrect:
* A: Deployment time is a one-time or infrequent process.
* C: Development time is less critical once the model is built.
* D: Data is already collected daily - assumed to be available.
Official References:
* CompTIA DataX (DY0-001) Official Study Guide - Section 5.4:"Time-sensitive applications such as daily pricing require fast model retraining, making training time a critical factor."
* Real-Time ML Deployment Handbook, Chapter 6:"Retraining time is the bottleneck in time- constrained systems that adapt to fresh inputs regularly."
-
NEW QUESTION # 23
A data scientist is creating a responsive model that will update a product's daily pricing based on the previous day's sales volume. Which of the following resource constraints is the data scientist's greatest concern?
- A. Deployment time
- B. Development time
- C. Data collection time
- D. Training time
Answer: D
Explanation:
Because the model must be retrained every day on yesterday's sales data to set today's prices, the time it takes to train the model becomes the critical bottleneck in a responsive, daily‐update workflow.
NEW QUESTION # 24
A data scientist is analyzing a data set with categorical features and would like to make those features more useful when building a model. Which of the following data transformation techniques should the data scientist use? (Choose two.)
- A. Label encoding
- B. One-hot encoding
- C. Scaling
- D. Pivoting
- E. Normalization
- F. Linearization
Answer: B
Explanation:
One-hot encoding creates binary indicator columns for each category, allowing models to treat nominal categories without implying any order.
Label encoding maps categories to integer labels, which can be useful for tree-based models or when you need a single numeric column (though you must ensure the algorithm can handle treated ordinality appropriately).
NEW QUESTION # 25
A data scientist observes findings that indicate that as electrical grids in a country become more and more connected over time, the frequency of brownouts and blackouts in total decrease, and the frequency of major brownouts and blackouts increase. Which of the following distribution metrics could best be identified?
- A. Scale axis magnitudes
- B. Normality
- C. Kurtosis
- D. Skewness
Answer: C
Explanation:
# Kurtosis is a statistical measure that describes the "tailedness" or extremity of values in a distribution. The observation that smaller events decrease while extreme events increase indicates a rise in heavy tails - a textbook sign of increasing kurtosis. This reflects a distribution becoming more prone to extreme values (e.g., more impactful blackouts).
Why the other options are incorrect:
* A: "Scale axis magnitudes" is not a statistical metric but refers to plotting.
* C: Skewness measures asymmetry, not the frequency of extreme values.
* D: Normality checks whether a distribution follows the normal distribution, not its tail behavior.
Official References:
* CompTIA DataX (DY0-001) Official Study Guide - Section 1.3:"Kurtosis measures the presence of outliers and extreme values in a distribution - higher kurtosis suggests more frequent extreme events."
* Applied Statistical Analysis, Chapter 4:"Kurtosis provides insight into the likelihood of extreme deviations and is useful in risk and reliability analysis."
-
NEW QUESTION # 26
A data scientist is standardizing a large data set that contains website addresses. A specific string inside some of the web addresses needs to be extracted. Which of the following is the best method for extracting the desired string from the text data?
- A. Find and replace
- B. Regular expressions
- C. Large language model
- D. Named-entity recognition
Answer: B
NEW QUESTION # 27
A team is building a spam detection system. The team wants a probability-based identification method without complex, in-depth training from the historical data set. Which of the following methods would best serve this purpose?
- A. Logistic regression
- B. Random forest
- C. Linear regression
- D. Naive Baves
Answer: D
Explanation:
Naive Bayes directly computes class probabilities using simple frequency counts under the independence assumption, requiring minimal training complexity and no iterative optimization-ideal for fast, probability‐based spam detection.
NEW QUESTION # 28
Which of the following layer sets includes the minimum three layers required to constitute an artificial neural network?
- A. An input layer, a convolutional layer, and a hidden layer
- B. An input layer, a dropout layer, and a hidden layer
- C. An input layer, a pooling layer, and an output layer
- D. An input layer, a hidden layer, and an output layer
Answer: D
Explanation:
By definition, an artificial neural network requires at least these three fundamental layers: the input layer to receive data, one or more hidden layers to perform transformations, and the output layer to produce predictions. Pooling, convolutional, and dropout layers are useful in specialized architectures (e.g., CNNs) but aren't part of the minimal ANN structure.
NEW QUESTION # 29
Which of the following issues should a data scientist be most concerned about when generating a synthetic data set?
- A. The data set consuming too many resources
- B. The data set having insufficient features
- C. The data set not being representative of the population
- D. The data set having insufficient row observations
Answer: C
Explanation:
If synthetic data don't accurately mirror the real-world distributions and relationships, any models trained on them will perform poorly in deployment. Representativeness is the critical concern when generating synthetic data.
NEW QUESTION # 30
A data analyst is examining the correlation matrix of a new data set to identify issues that could adversely impact model performance. Which of the following is the analyst most likely checking for?
- A. Multicollinearity
- B. Oversampling
- C. Undersampling
- D. Overfitting
Answer: A
Explanation:
# Multicollinearity occurs when independent variables are highly correlated with each other. This can distort coefficient estimates and reduce model interpretability. A correlation matrix is the primary tool used to detect it.
Why the other options are incorrect:
* A & C: Under/oversampling relate to class imbalance, not variable correlation.
* D: Overfitting is related to model complexity, not directly observable via a correlation matrix.
Official References:
* CompTIA DataX (DY0-001) Study Guide - Section 3.2:"Correlation matrices are used to detect multicollinearity - high correlations among predictors that may destabilize models."
NEW QUESTION # 31
Which of the following methods should a data scientist use just before switching to a potential replacement model?
- A. CI/CD
- B. A/B testing
- C. Performance monitoring
- D. Containerization
Answer: B
Explanation:
# A/B testing allows a controlled experiment comparing the performance of two models - the current (A) vs.
the candidate (B) - on live data. It's an industry best practice to validate real-world behavior before full replacement.
Why the other options are incorrect:
* B: Performance monitoring helps detect drift but doesn't directly compare models.
* C: CI/CD automates deployment but doesn't evaluate performance differences.
* D: Containerization packages the model but doesn't test it comparatively.
Official References:
* CompTIA DataX (DY0-001) Study Guide - Section 5.5:"A/B testing is a recommended approach to validate model performance before switching versions in production."
* ML System Operations Guide, Chapter 6:"Use A/B testing to ensure new models outperform baselines before full rollout."
-
NEW QUESTION # 32
Which of the following best describes the minimization of the residual term in a LASSO linear regression?
- A. |e|
- B. 0
- C. e
- D. e²
Answer: D
Explanation:
# LASSO (Least Absolute Shrinkage and Selection Operator) regression minimizes the squared residuals (e²), just like OLS, but adds an L1 penalty to encourage sparsity in the coefficients. Thus, the residual component minimized is still the sum of squared errors.
Why the other options are incorrect:
* A: |e| is absolute error, not used in standard LASSO objective.
* B: e is the error term, but minimization applies to its squared version.
* C: Minimizing to exactly 0 is idealistic but not realistic.
Official References:
* CompTIA DataX (DY0-001) Study Guide - Section 3.3:"LASSO minimizes squared errors with an additional L1 regularization term."
* Elements of Statistical Learning, Chapter 6:"LASSO regression uses the same residual sum of squares (e²) as OLS for error measurement, with an added constraint."
-
NEW QUESTION # 33
A data scientist is presenting the recommendations from a monthslong modeling and experiment process to the company's Chief Executive Officer. Which of the following is the best set of artifacts to include in the presentation?
- A. Results, recommendations, justifications, and clear charts
- B. Recommendation charts justifications code reviews and results
- C. Methodology, code snippets, findings, data tables, and p values
- D. Methods, data overview, results, recommendations, and charts
Answer: A
Explanation:
Executive audiences need concise, high-level insights: what you found (results), what you suggest (recommendations), why it matters (justifications), and visual summaries (clear charts). Detailed methods, code, or raw data aren't appropriate at the C-suite level.
NEW QUESTION # 34
Which of the following belong in a presentation to the senior management team and/or C-suite executives? (Choose two.)
- A. Full literature reviews
- B. High-level results
- C. Security keys and login information
- D. Code snippets
- E. Detailed explanations of statistical tests
- F. Final recommendations
Answer: F
Explanation:
Senior leaders need actionable insights and the overarching outcomes, not the implementation details, so you present your key recommendations alongside a summary of results at a high level.
NEW QUESTION # 35
A data scientist is developing a model to predict the outcome of a vote for a national mascot. The choice is between tigers and lions. The full data set represents feedback from individuals representing 17 professions and 12 different locations. The following rank aggregation represents 80% of the data set: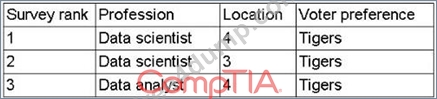
(Screenshot shows survey rankings for just two professions and a few locations, all voting for "Tigers") Which of the following is the most likely concern about the model's ability to predict the outcome of the vote?
- A. Out-of-sample data
- B. Extrapolated data
- C. In-sample data
- D. Interpolated data
Answer: B
Explanation:
# Extrapolated data refers to making predictions about data points that fall outside the observed range or distribution. Since the sample data (80%) is heavily skewed toward a small subset of professions and locations, predicting results for the remaining, unrepresented professions and regions involves extrapolation.
Why the other options are incorrect:
* A: Interpolation occurs within the bounds of observed data - not the issue here.
* C: In-sample data refers to training data, which is overrepresented in this case.
* D: Out-of-sample data is a concern in generalization but extrapolation is more specific here.
Official References:
* CompTIA DataX (DY0-001) Study Guide - Section 3.2:"Extrapolation introduces risk when models are used outside the range of data they were trained on, especially if certain subgroups are underrepresented."
-
NEW QUESTION # 36
A data analyst wants to generate the most data using tables from a database. Which of the following is the best way to accomplish this objective?
- A. INNER JOIN
- B. LEFT OUTER JOIN
- C. RIGHT OUTER JOIN
- D. FULL OUTER JOIN
Answer: D
Explanation:
# FULL OUTER JOIN returns all rows from both tables, inserting NULLs where no match exists. This join includes the maximum possible number of records - all matches, plus all unmatched records from both sides.
Why the other options are incorrect:
* A: INNER JOIN returns only matching rows - less total data.
* B & C: LEFT/RIGHT JOIN include all rows from one table only.
Official References:
* CompTIA DataX (DY0-001) Study Guide - Section 5.2:"A FULL OUTER JOIN maximizes data volume by including all matched and unmatched records from both tables."
* SQL for Data Science, Chapter 4:"Use FULL OUTER JOIN when the goal is to preserve every record from both datasets regardless of match."
-
NEW QUESTION # 37
A data scientist has built a model that provides the likelihood of an error occurring in a factory. The historical accuracy of the model is 90%. At a specific factory, the model is reporting a likelihood score of 0.90. Which of the following explains a confidence score of 0.90?
- A. Running this model 100 times on a factory, it is expected the model will predict 90 out of 100 factory errors.
- B. Running this model on 100 samples of factories, a certain model performance is expected for 90 out of the 100 samples.
- C. Running this model 100 times within a factory it is expected the model will predict error 90 out of 100times the model is ran.
- D. Running this model for all known factory issues, it is expected the model will identify 90 out of 100 known factory issues.
Answer: C
Explanation:
# A likelihood score of 0.90 indicates the model's confidence that an error will occur in this particular instance. Interpreted probabilistically, it means that if this scenario happened 100 times, the model would expect an error in 90 of those cases.
Why the other options are incorrect:
* A: Confuses confidence with recall or precision.
* B: Refers to model sampling performance, not instance-level prediction.
* C: Implies a prediction of actual factory errors - not the model's forecast probability.
Official References:
* CompTIA DataX (DY0-001) Study Guide - Section 3.2:"A confidence score in a classification model indicates the model's belief in the outcome of a specific prediction."
-
NEW QUESTION # 38
A data scientist is analyzing a data set with categorical features and would like to make those features more useful when building a model. Which of the following data transformation techniques should the data scientist use? (Choose two.)
- A. One-hot encoding
- B. Scaling
- C. Pivoting
- D. Normalization
- E. Label encoding
- F. Linearization
Answer: A,E
Explanation:
# Categorical variables must be transformed into numerical form for most machine learning models. Two standard approaches:
* One-hot encoding: Converts each category into a separate binary column (useful for nominal variables).
* Label encoding: Converts categories into integers (useful for ordinal or tree-based models).
Why other options are incorrect:
* A & E: Normalization and scaling are used for continuous variables, not categorical.
* C: Linearization refers to transforming relationships, not categorical conversion.
* F: Pivoting rearranges data structure but doesn't encode categories.
Official References:
* CompTIA DataX (DY0-001) Study Guide - Section 3.3:"Label encoding and one-hot encoding are common transformations applied to categorical variables to enable model compatibility."
-
NEW QUESTION # 39
A data analyst wants to generate the most data using tables from a database. Which of the following is the best way to accomplish this objective?
- A. INNER JOIN
- B. LEFT OUTER JOIN
- C. RIGHT OUTER JOIN
- D. FULL OUTER JOIN
Answer: D
Explanation:
A full outer join returns every row from both tables, matched where possible and unmatched rows filled with NULLs, yielding at least as many (and typically more) rows than any other join type.
NEW QUESTION # 40
......
Accurate & Verified New DY0-001 Answers As Experienced in the Actual Test!: https://www.free4dump.com/DY0-001-braindumps-torrent.html
Valid DY0-001 Test Answers Full-length Practice Certification Exams: https://drive.google.com/open?id=1pJ72v1bTFq9FxKrswXVTo7TY2lKcaWiA